Protein in Nuts Chart
Choose a nut type, serving size and minimum protein filter to compare protein grams across nuts and seeds.
Your result
Choose your portion and build the chart.
Selected portion
— g protein
| Food | Protein | Density |
|---|
· Free
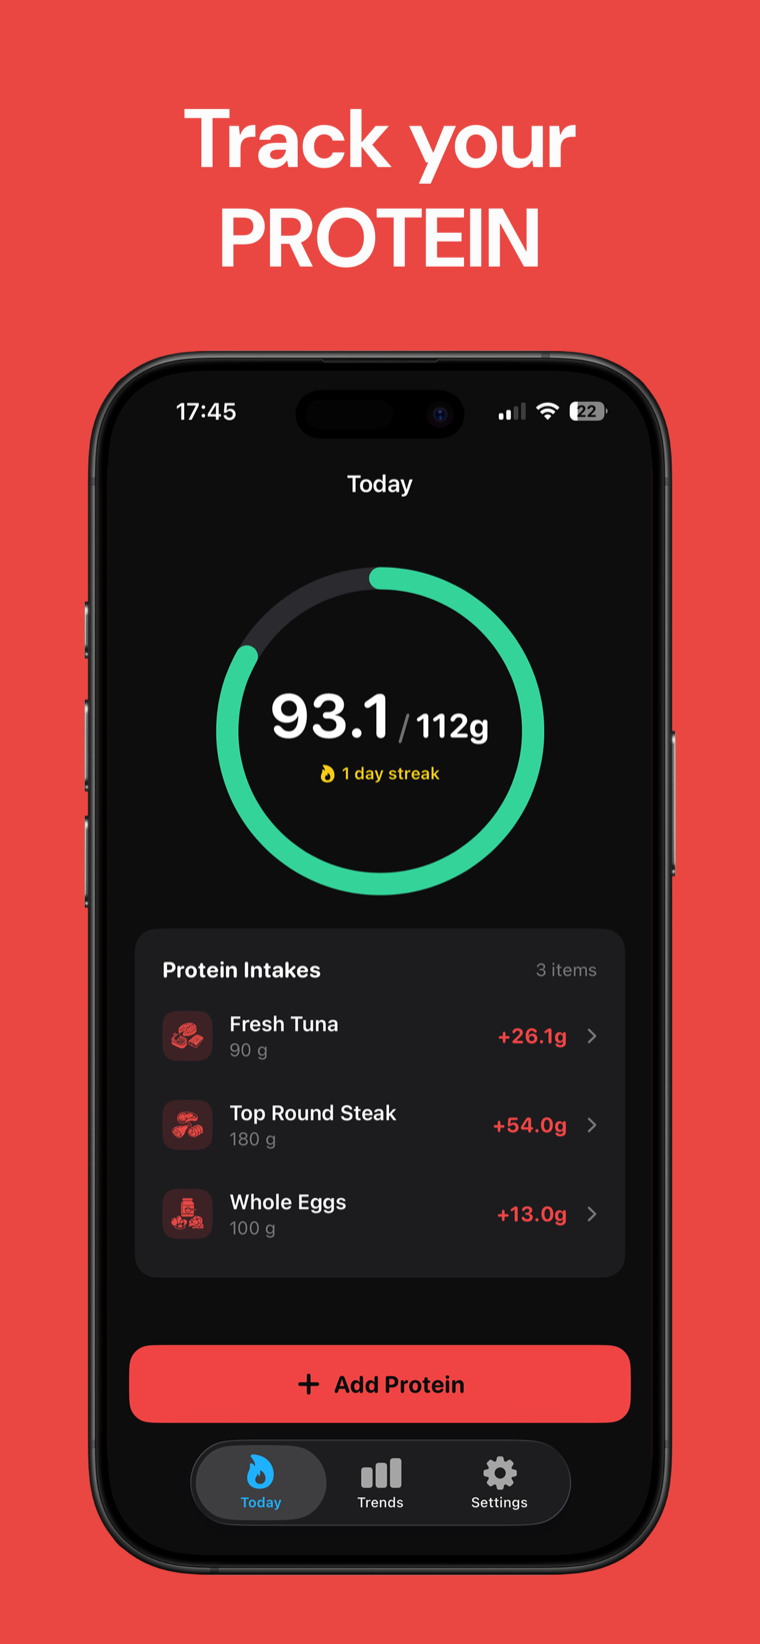
Track it in Protein Tracker.
Keep protein logs, meal notes and portion comparisons organized on your device.

How the protein in nuts chart works
This protein in nuts chart converts each listed food's protein-per-100-gram value to the serving size you enter. It shows the selected portion first, then compares every listed nut or seed that meets your minimum protein filter.
The chart can be sorted by protein grams in your portion or by protein density. Values are composition references, and a single food comparison is not a diagnosis; a clinician decides what is appropriate for your individual needs.
Protein grams = serving weight in g ÷ 100 × protein per 100 g The source lists a 1 oz nuts serving as 28 g. The protein reference value is 0.8 g per kg body weight per day as a floor; this chart does not calculate an individual target.
Protein in nuts chart FAQ
What serving size does the chart use?
It starts at 28 g, the 1 oz nuts serving listed in the source. You can enter another positive serving weight in grams.
How is protein calculated?
The tool multiplies your serving weight divided by 100 by the food's static protein-per-100-gram value.
What does protein density mean here?
Protein density is the listed protein amount per 100 g, so it lets you compare the composition of foods independent of your selected portion.
Why is a food missing after I set a filter?
Rows are shown only when their calculated protein grams meet or exceed your minimum protein filter.
Can this chart tell me how much protein I should eat?
No. It is a food comparison only. The source gives a general reference floor, but a clinician or qualified dietitian decides what fits your individual needs.